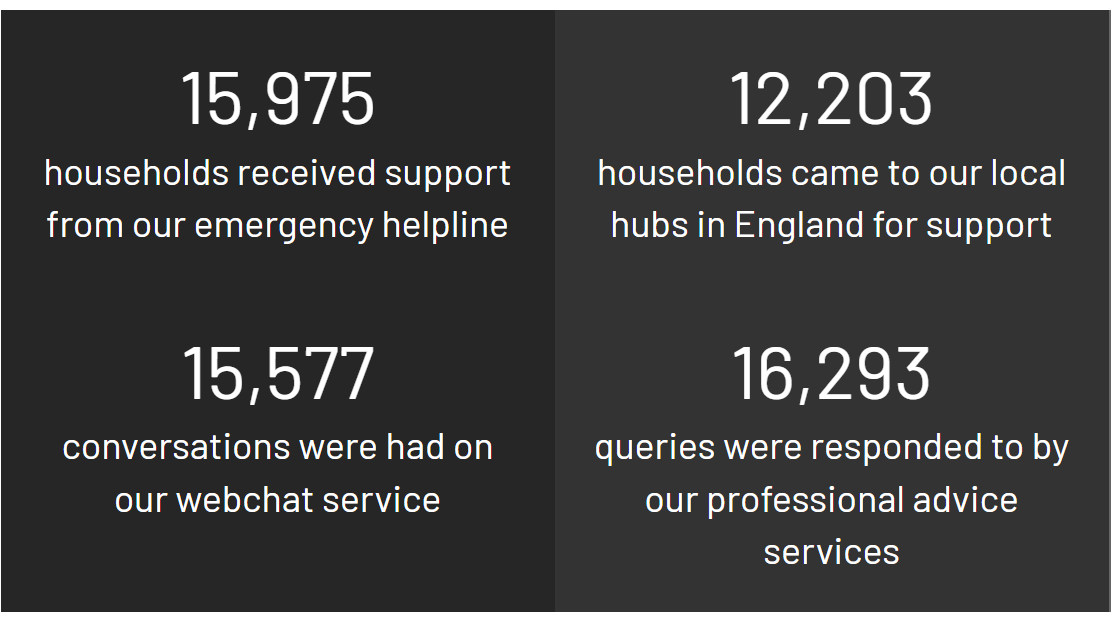
Stats component
Statistics are a big weapon in Shelter's fight to end the housing emergency. Powerful numbers from our research need to be used consistently throughout our campaigning. So our websites need a visually strong way to express them.
The stats component lets us create stats in groups of 3 (as a line) or 4 (as a grid).
For each stat we can include a title, subtitle and text, or any combination of these. This example uses all three fields:

This example uses title and subtitle fields only:

Here we use only the title and text:

And this uses only text:

The text field also allows for hyperlinks.
To create the stats component
Use Add entry and select Component – Stats
Name – this is the system name seen in Contentful
Display type – select Line or Grid
For each of the stats (between 2 and 4), you can enter:
Title
Subtitle
Text – there's no character limit but be concise
5. Remove margin bottom – select ‘Yes’ if you want to remove the 40-pixel white padding below the stats
6. Publish your stats and add them to pages
Any questions? Email Lindsay Foley in the Central Digital team.
